 Goal 6. Clean Water and Sanitation
6.2.1 Measure the total volume of water used in the university that is taken from mains supply, desalinated, or extracted from rivers, lakes, or aquifers
AASTMT relies on two primary water sources: tap water treated from government purification facilities and groundwater extracted from underground sources, mainly for irrigation. Since 2017, AASTMT has implemented monthly water consumption monitoring to establish a systematic approach to tracking water usage trends. Data is collected through meters that measure potable water supplied by the municipal water distribution system, groundwater extraction from wells, and wastewater discharged into the sewage system.
Insert your text here
Measurement of the Total Volume of Water Consumed Water used in the University (2023-2024)
AASTMT implements a comprehensive water-monitoring system across all campuses to accurately measure the total volume of water used from different sources. Each campus is equipped with main water meters at all municipal supply entry points, along with sub-meters installed in academic buildings, dormitories, administrative units, and specialized facilities. In campuses that rely partly on groundwater, such as Abukir and Port Said, dedicated flow meters are installed on borehole wells to record the exact volumes extracted from aquifers. Monthly readings are collected and documented by the Facilities and Maintenance Department, covering both municipal (mains) water and groundwater used for irrigation, firefighting, cooking, drinking, and sanitation.
Water consumption across all AASTMT campuses is monitored through a network of flow meters, with readings recorded on a monthly basis. This data captures water use for multiple purposes, including drinking, cooking, fire safety, laundry, pool operation, irrigation, and sanitation—while accounting for variations in campuses that host student dormitories. This unified metering framework ensures that AASTMT can accurately track total water consumption from all sources—mains supply, groundwater extraction, and treated water—supporting transparent reporting for SDG 6 and enabling informed water-management decisions across all campuses.
Below is an example of the measured consumption data for Abukir Campus, which is the largest one among all in AAST for 2022-2023, followed by a comparison for annual water consumption since 2017-2023. Abukir campus on its own has a total of 25 water meters as in the table below. Additionally, all AASTMT campuses are demonstrated showing the total annual consumption of each since 2021. Additionally, all AASTMT campuses are demonstrated showing the total annual consumption of each since 2021.
Function | Number |
District Alexandria Water Company (Government) meters | 7 |
AAST meters for water consumption of the leased entities (cafeterias) | 11 |
AAST meters for extracted underground water used in irrigation | 7 |
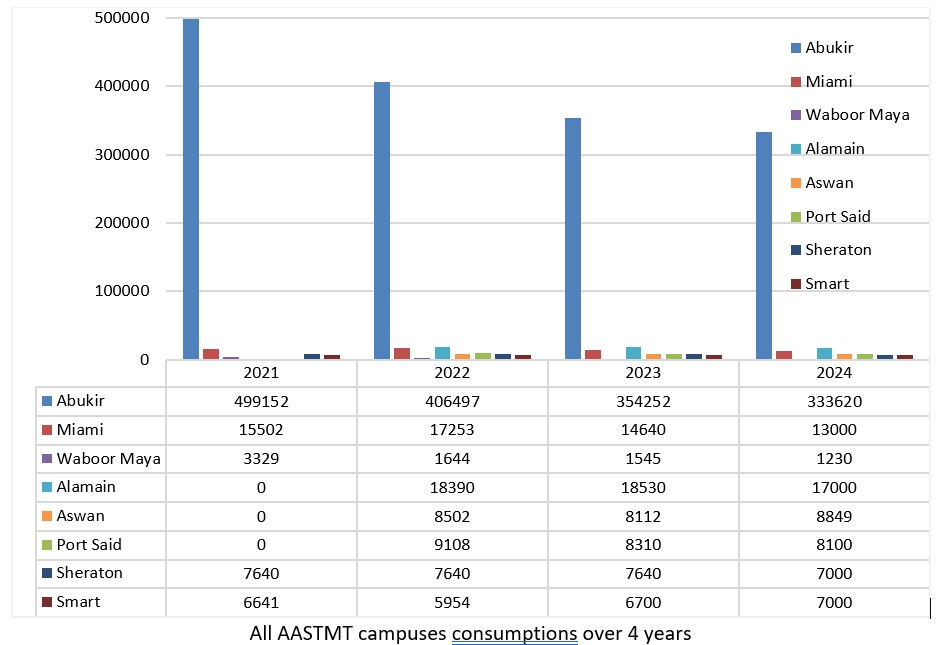
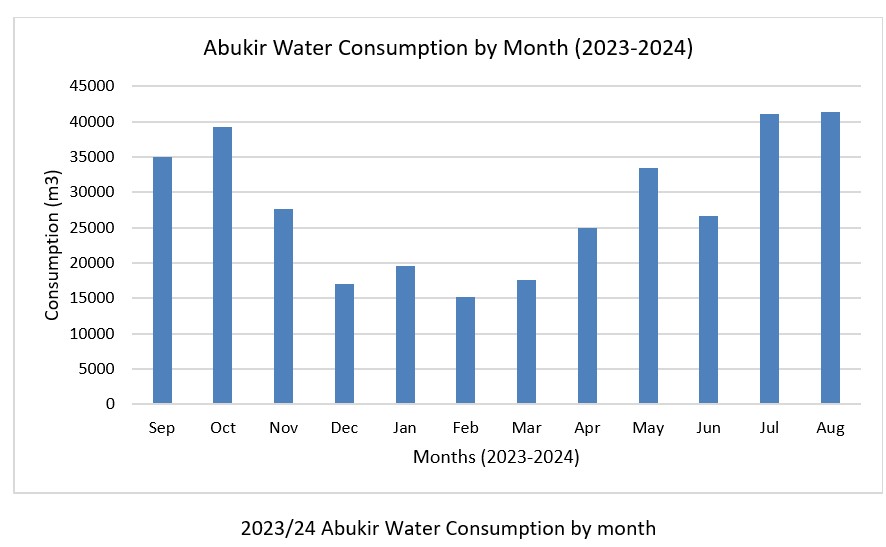
A comparison between 2023 and 2024 shows a continued improvement in water conservation across AASTMT campuses. Abukir Campus, which represents the largest share of total consumption, reduced its water use from 354,252 m³ in 2023 to 333,620 m³ in 2024, reflecting a further decrease of 20,632 m³. Similar downward trends are observed in several other campuses, including Miami, Wabour Maya, Sheraton, and Port Said, all showing moderate reductions in usage. These year-to-year declines highlight the effectiveness of strengthened monitoring, optimized irrigation schedules, leak detection measures, and the integration of more water-conscious practices. Overall, 2024 demonstrates measurable progress in reducing water demand compared to 2023, reinforcing AASTMT’s commitment to efficient water use and SDG 6 targets. Abukir has the highest contribution among all campuses, the figure below presents the water consumption for the month of August, which consistently records the highest levels in recent years.
Measurement of the Total Volume of Water Consumed Water used in the University (2022-2023)
Water usage across all AASTMT campuses is systematically measured using flow meters, with the data recorded monthly. The collected information tracks water consumption for various purposes, including drinking, cooking, fire suppression, laundry, pool maintenance, irrigation, and sanitation taking into account that some campuses have student dorms.
.png)
In 2022-2023, a significant reduction of 38.3% in water consumption was observed compared to 2020 levels, excluding 2021 due to the pandemic. This reduction highlights the impact of sustainable practices aimed at optimizing water use, minimizing wastage, and promoting environmental responsibility within the campus. Abukir has the highest contribution among all campuses, the figure below presents the water consumption for the month of August, which consistently records the highest levels in recent years (The billing of August appears in the September bill as indicated below).
.png)
.png)
.png)
Carbon Footprint Estimation and Reduction in the AASTMT Campus Towards developing a Model for Promoting Sustainable Development Goals (Green Campus) (2020-2021)
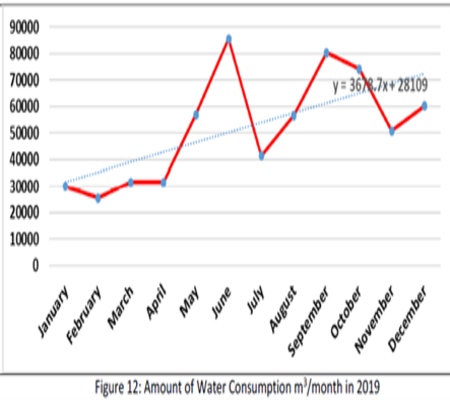
Maintaining a comprehensive record of water bills for each AASTMT campus and analyzing the overall water consumption of the university is crucial for several reasons. Firstly, it enables the university to actively monitor and manage its water usage patterns, identifying areas of high consumption and potential areas for optimization. By having detailed records, AASTMT can implement targeted water conservation measures, promoting sustainability and reducing environmental impact. Additionally, analyzing water bills provides valuable data for budgeting and resource allocation, allowing the university to make informed decisions about water-related expenditures. The main objective of the study is to calculate a transparent carbon footprint of AASTMT’s Abu Kir campus from 2018 to 2021, identify the role of COVID-19 on the carbon footprint of AASTMT. The project aimed to establish a framework for ongoing monitoring and reporting of water consumption, both yearly and monthly, which can help to mitigate climate change by reducing AASTMT’s greenhouse gas emissions. Abu Kir campus was used as a pilot project as an initial step.
The report provides a detailed analysis of water consumption and resulting carbon emissions in AASTMT. It includes data on water consumption for each year from 2018 to 2021, as well as figures and tables that illustrate the trends in water consumption and carbon emissions over time. For example, Figure 8 shows the total amount of water consumption in cubic meters per year, while Figures 9 to 16 visualize the monthly water consumption and resulting emissions for each year individually. The graphs exhibit variations in water consumption and emissions throughout the year, which can be attributed to various factors such as the academic calendar, weather, and specific events or activities on campus. The report also presents figures that show the emissions resulting from water consumption, such as Figure 11, which displays the calculated emissions (in kg CO2e/year) from water consumption in 2018.
In addition, the report highlights various measures that have been implemented to reduce water consumption and associated carbon emissions on campus, such as the installation of water-efficient fixtures and the implementation of water conservation campaigns.
Link for Evidence: